目录
perfetto支持内存泄露定位和调试Heapprofd,本文基于Heapprofd在原生linux上演示,用来追钟malloc的分配和释放
什么是heapprofd
heapprofd本意是在android平台上提供低开销的原生堆分析机制,支持 C++ 和 Java 调用栈归因,供 Android 系统上的所有进程使用。这包括Java和原生服务。该机制能够将堆转储导出为跟踪,以便将堆信息与系统中的其他活动关联起来。此功能是在Android 10版本中添加的。其框架图如下
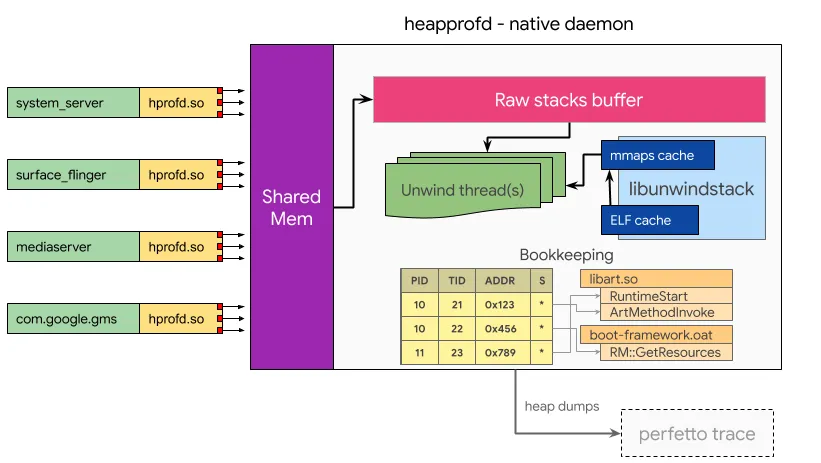
可以看到,我们通过hprofd.so对程序的malloc进行hook,然后获取其fp,通过libunwind将其栈展开。最终导出成perfetto可以查看的trace文件。
使用场景
heapprofd有三种使用场景,分别为
- 对已有进程进行分析
- 在程序启动时加载分析
- 对整个系统进行内存分析
本文以程序启动时加载的方式来介绍分享
glibc malloc的heapprofd编译
根据架构图,我们需要为glibc生成一个heapperofd的so文件,src/profiling/memory/malloc_interceptor_glibc_preload.cc 提供了glibc的实现,我们只需要编译即可
# apt-get install -y gn
# python3 tools/install-build-deps --no-dev-tools
# gn gen out/linux_clang_release
# /usr/bin/ninja -C out/linux_clang_release heapprofd_glibc_preload
编译完成之后我们得到编译产物为out/linux_clang_release/libheapprofd_glibc_preload.so
接下来就可以直接使用perfetto的二进制采集heap信息了,这里使用perfetto提供的python程序tools/heap_profile
# tools/heap_profile  -h
usage: heap_profile [-h] [-i INTERVAL] [-d DURATION] [--no-start] [-p PIDS] [-n NAMES] [-c CONTINUOUS_DUMP] [--heaps HEAPS] [--all-heaps] [--no-android-tree-symbolization] [--disable-selinux] [--no-versions] [--no-running]
                    [--no-startup] [--shmem-size SHMEM_SIZE] [--block-client] [--block-client-timeout BLOCK_CLIENT_TIMEOUT] [--no-block-client] [--idle-allocations] [--dump-at-max] [--disable-fork-teardown] [--simpleperf]
                    [--traceconv-binary TRACECONV_BINARY] [--no-annotations] [--print-config] [-o DIRECTORY]
                    {android,host} ...

Collect a heap profile

  The PERFETTO_PROGUARD_MAP=packagename=map_filename.txt[:packagename=map_filename.txt...] environment variable can be used to pass proguard deobfuscation maps for different packages.

positional arguments:
  {android,host}
    android             Profile a process on a connected Android device via adb (default).
    host                Profile a local Linux process via LD_PRELOAD.

options:
  -h, --help            show this help message and exit
  -i INTERVAL, --interval INTERVAL
                        Sampling interval. Default 4096 (4KiB)
  -d DURATION, --duration DURATION
                        Duration of profile (ms). 0 to run until interrupted. Default: until interrupted by user.
  --no-start            Do not start heapprofd.
  -p PIDS, --pid PIDS   Comma-separated list of PIDs to profile.
  -n NAMES, --name NAMES
                        Comma-separated list of process names to profile.
  -c CONTINUOUS_DUMP, --continuous-dump CONTINUOUS_DUMP
                        Dump interval in ms. 0 to disable continuous dump.
  --heaps HEAPS         Comma-separated list of heaps to collect, e.g: libc.malloc,com.android.art. Requires Android 12.
  --all-heaps           Collect allocations from all heaps registered by target.
  --no-android-tree-symbolization
                        Do not symbolize using currently lunched target in the Android tree.
  --disable-selinux     Disable SELinux enforcement for duration of profile.
  --no-versions         Do not get version information about APKs.
  --no-running          Do not target already running processes. Requires Android 11.
  --no-startup          Do not target processes that start during the profile. Requires Android 11.
  --shmem-size SHMEM_SIZE
                        Size of buffer between client and heapprofd. Default 8MiB. Needs to be a power of two multiple of 4096, at least 8192.
  --block-client        When buffer is full, block the client to wait for buffer space. Use with caution as this can significantly slow down the client. This is the default
  --block-client-timeout BLOCK_CLIENT_TIMEOUT
                        If --block-client is given, do not block any allocation for longer than this timeout (us).
  --no-block-client     When buffer is full, stop the profile early.
  --idle-allocations    Keep track of how many bytes were unused since the last dump, per callstack
  --dump-at-max         Dump the maximum memory usage rather than at the time of the dump.
  --disable-fork-teardown
                        Do not tear down client in forks. This can be useful for programs that use vfork. Android 11+ only.
  --simpleperf          Get simpleperf profile of heapprofd. This is only for heapprofd development.
  --traceconv-binary TRACECONV_BINARY
                        Path to local trace to text. For debugging.
  --no-annotations      Do not suffix the pprof function names with Android ART mode annotations such as [jit].
  --print-config        Print config instead of running. For debugging.
  -o DIRECTORY, --output DIRECTORY
                        Output directory.
接下来我们就可以采集系统上的malloc信息分布了
我们只需要将preload的so设置为我们刚刚编译的so即可。然后直接调用tracebox抓取数据,导出到
# python3 tools/heap_profile host -i 4096 -n python3 --preload-library out/linux_clang_release/libheapprofd_glibc_preload.so  --tracebox-binary /root/claude/perfetto_binary/tracebox -- python3 -c "import sys; print('test')"
[829.759] approfd_producer.cc:250 Connected to the service, mode [child].
[829.760] approfd_producer.cc:373 Setting up datasource: non-statsd initiator.
[829.760] approfd_producer.cc:457 Set up data source.
[829.760] approfd_producer.cc:521 Starting data source 1
[829.760] approfd_producer.cc:564 Started DataSource
[829.760] approfd_producer.cc:890 1819873: Received FDs.
test
[829.781] ctory_standalone.cc:161 Child disconnected.
Waiting for profiler shutdown...
[829.782] approfd_producer.cc:580 Stopping data source 1
[829.801]        unwinding.cc:186 Unwinding error 2
[829.831] pprofd_producer.cc:1230 1819873 disconnected from heapprofd (ds shutting down: 1).
[829.839] approfd_producer.cc:346 Shutting down child heapprofd (status 0).
Wrote profiles to /tmp/6c5112 (symlink /tmp/heap_profile-latest)
The raw-trace file can be viewed using https://ui.perfetto.dev.
The heap_dump.* files can be viewed using pprof/ (Googlers only) or https://www.speedscope.app/.
The two above are equivalent. The raw-trace contains the union of all the heap dumps.
我们看到trace导出在 /tmp/heap_profile-latest 我们看看文件有哪些
heap_dump.1.1819873.libc.malloc.pb.gz raw-trace
这里heap_dump.1.1819873.libc.malloc.pb.gz是内存火焰图,而raw-trace是perfetto能够识别的trace,我们先加载火焰图看看
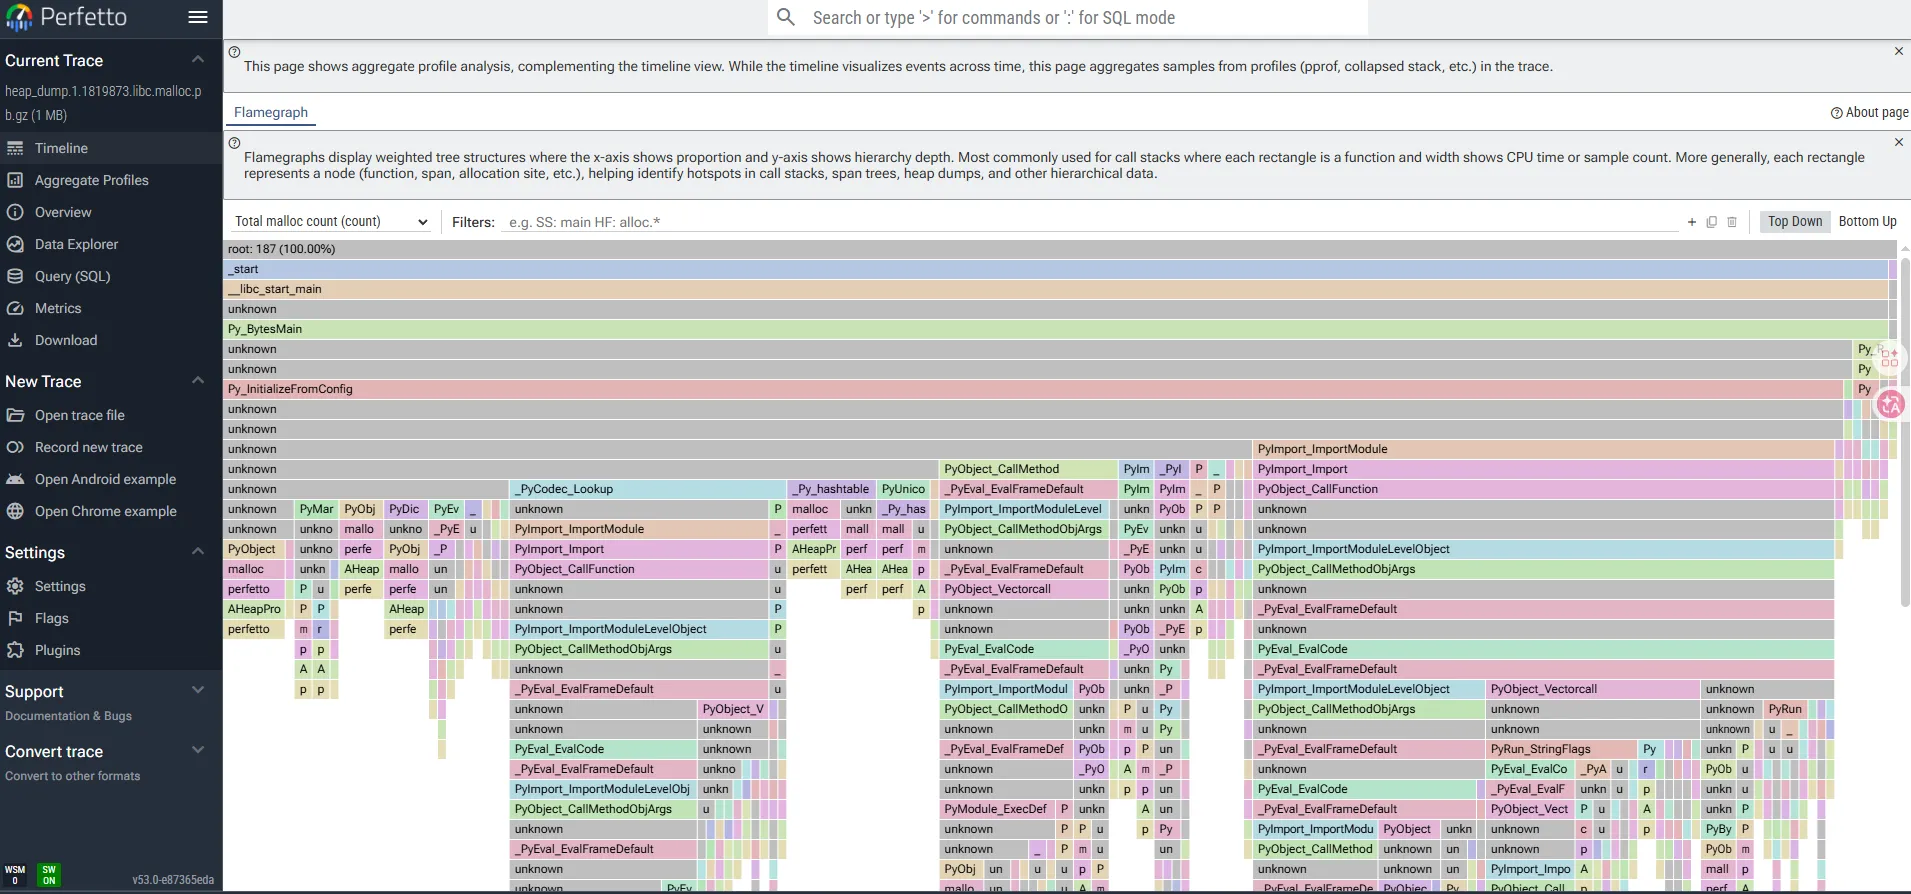
可以看到perfetto正常加载了火焰图并展示
注意这里提供了四类数据
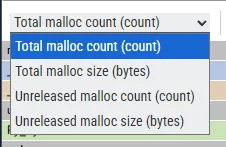
也就是
- malloc的次数
- malloc的大小
- 未释放的malloc次数
- 未释放的malloc大小
现在我们看看原生perfetto的trace的效果,加载raw-trace
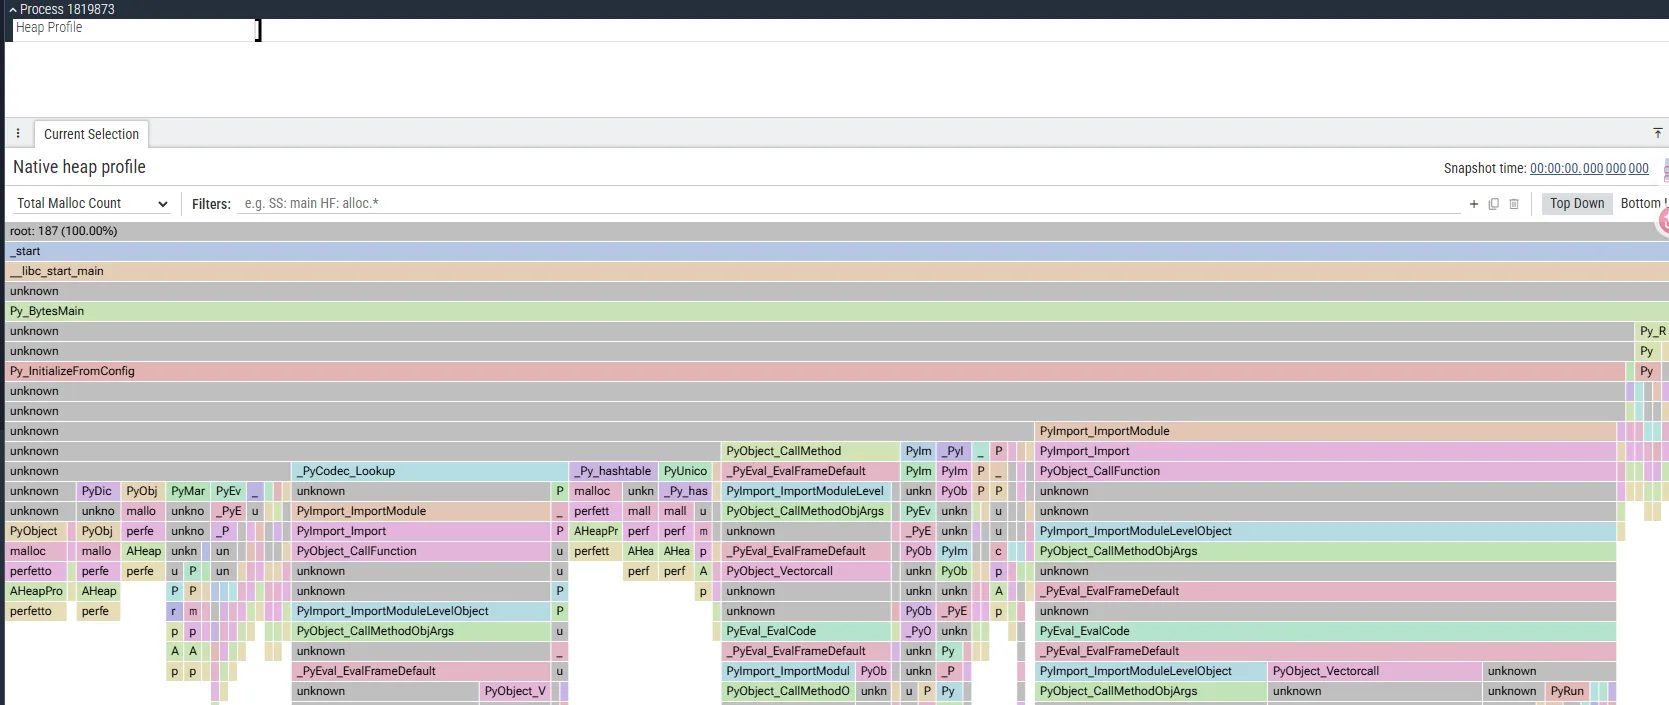
可以看到perfetto的track上提供了Process 1819873的track轨道信息。我们点击即可显示下面的火焰图。这个设计就是非常方便我们集成内存火焰图和调度图进行统一分析。
总结
本文基于ubuntu的glibc演示了perfetto的heap_profile,通过这个工具我们抓取了malloc的分配和释放,并进行了统计。这样能够非常精准的查看内存的分配信息。有助于我们调试内存问题
参考
- https://perfetto.dev/docs/design-docs/heapprofd-design
- https://perfetto.dev/docs/design-docs/heapprofd-sampling
- https://perfetto.dev/docs/design-docs/heapprofd-wire-protocol
- https://perfetto.dev/docs/data-sources/native-heap-profiler
- https://deepwiki.com/google/perfetto/7.2-memory-profiling-implementation